No edit summary |
No edit summary |
||
| (9 intermediate revisions by the same user not shown) | |||
| Line 9: | Line 9: | ||
Once the schematic is completed, you have to select the type of analysis, form the category '''simulations''' of the Component view: drag & drop the type on the schematic. Edit its properties and run the simulation by clicking the '''Simulate''' button. | Once the schematic is completed, you have to select the type of analysis, form the category '''simulations''' of the Component view: drag & drop the type on the schematic. Edit its properties and run the simulation by clicking the '''Simulate''' button. | ||
'''Remeber to always insert the ground symbol'''. | |||
To begin, create a schematic, for example like this: | To begin, create a schematic, for example like this: | ||
[[Image: Schematic-Resistence.png]] | [[Image: Schematic-Resistence.png]] | ||
Edit the component properties double clicking on them. | |||
To insert the label '''Vout''', select the button '''Wire-label'''. | |||
As the system is linear, applying the superposition principle, we have:<BR> | As the system is linear, applying the superposition principle, we have:<BR> | ||
| Line 19: | Line 24: | ||
Insert a '''dc''' and a '''transient''' simulator in the schematic. Edit the transient editor properties, setting the '''start''' and '''stop''' properties and then start the simulation. | Insert a '''dc''' and a '''transient''' simulator in the schematic. Edit the transient editor properties, setting the '''start''' and '''stop''' properties and then start the simulation. | ||
At the end of the simulation, the '''Data display''' tab opens. From the '''diagrams''' category drag and drop '''tabular''' and '''cartesian'''. Edit their properties, selecting the ''Vout'', and ''I'' | At the end of the simulation, the '''Data display''' tab opens. From the '''diagrams''' category drag and drop '''tabular''' and '''cartesian'''. Edit their properties, selecting the ''Vout'', and ''I'' you want visualize. Click the '''Apply''' to preview the results. When done the output should be like something: | ||
[[Image: Simulation-Resistence.png]]. | [[Image: Simulation-Resistence.png]]. | ||
Note: '''e-x = 10<sup>-x</sup>''' | |||
The tabular diagram reports two DC results, Vout and the current I measured by the instrument. The cartesian diagram reports the evolution in time (x-axis) of the Vout (y-axis), a typical sinusoid the cycles around the value 1 V (DC output). | |||
== == | |||
Transient evolutions, however are more interesting when the circuit has reactive components as capacitances or inductances, and some switches that open/close at certain time. With the theory of electrical linear circuits we can mathematically study the signals in the circuits and | |||
with Qucs we can verify our analysis. | |||
Suppose to analize the transient of the RC circuit in figure. The conditions at time t=0 are Vc3=0 and switch closed. From theory we know that τ, the ''time'' characteristics of the circuit are τ<sub>1</sub>=R1//R2*C3=0.3 ms and τ<sub>2</sub>=R2*C=1 ms, before and after the circuit switch. So the condensator will be charged after ~ 3*τ<sub>1</sub>=0.9 ms and completely discarged after ~ 3*τ<sub>2</sub>=3 ms. We open the switch at time t=2.5 ms. | |||
Running the simulation we have this results, as expected. | |||
[[Image: RC-Schematic.png]] [[Image: Simulation-RC.png]] | |||
You can '''Set Marker on the Graph''', using the button '''M1''' (alias Marker1). | |||
== Digital Simulation == | |||
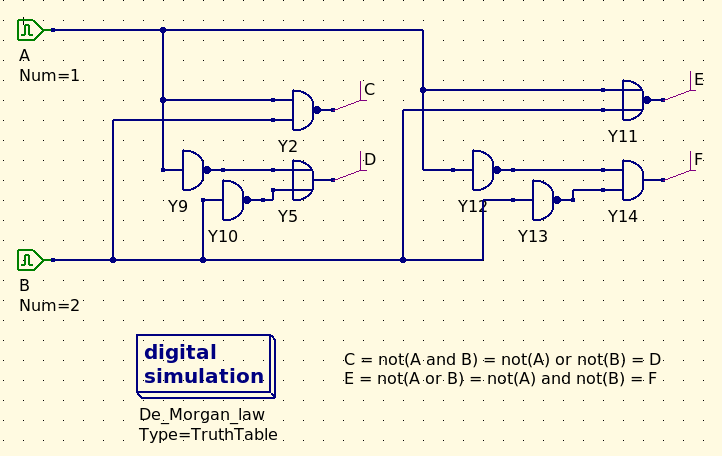
[[Image: Shematic-DeMorganLaw.png]] | |||
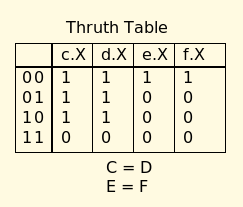
[[Image: TruthTable-DeMorgan.png]] | |||
Latest revision as of 11:04, 29 July 2010
Qucs: A circuit simulator
Launch Qucs: Applications --> Electronics --> Qucs.
Qucs presents a window subdivided in two sections. The main section is an area that houses Schematic (design window) where you place your electrical components, and Data Display (simulation window), where you visualize the analytical results. The other section, on the left, has three visualizations mode: Components, Contents and Projects. In the Components view, you can navigate between various categories, selecting the drop-down list at the top of its window. If you need a DC Voltage source, select source; a Resistor, Capacitor or Inductance, lumped components; a diode or a transistor non-linear components. So if you work in the G-Hz range or in the u-wave sector, select Trasmission-Lines.
Drag and drop the components in the Schematic area. Here you can Rotate the elements and the associated labels, using the context-menu (right clicking on the element) or the buttons at top window, for better placing. To edit the element properties double click on it or select the context menu.
To connect the elements, click on the Wire button, which transforms the mouse punctator in two perpendicular lines. Position and click the mouse on the red circle terminal, and complete the connection: a dashed line previews the connection. To exit from wire-mode de-select the wire button or activate select mode, clicking on the Select button.
Once the schematic is completed, you have to select the type of analysis, form the category simulations of the Component view: drag & drop the type on the schematic. Edit its properties and run the simulation by clicking the Simulate button.
Remeber to always insert the ground symbol.
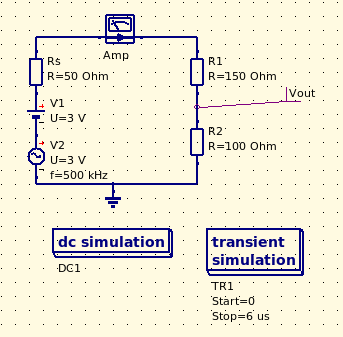
To begin, create a schematic, for example like this:
Edit the component properties double clicking on them. To insert the label Vout, select the button Wire-label.
As the system is linear, applying the superposition principle, we have:
Vout = (V1 + V2)*R2/(Rs+R1+R2), where V1=3 V and V2=3*sin(2πft) V, and the DC current I=V1/(Rs+R1+R2)=10 mA.
Insert a dc and a transient simulator in the schematic. Edit the transient editor properties, setting the start and stop properties and then start the simulation.
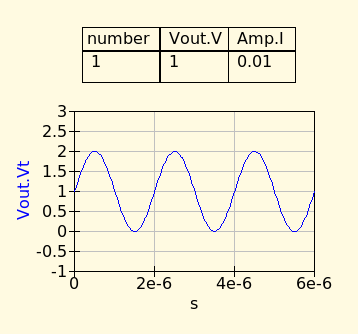
At the end of the simulation, the Data display tab opens. From the diagrams category drag and drop tabular and cartesian. Edit their properties, selecting the Vout, and I you want visualize. Click the Apply to preview the results. When done the output should be like something:
Note: e-x = 10-x
The tabular diagram reports two DC results, Vout and the current I measured by the instrument. The cartesian diagram reports the evolution in time (x-axis) of the Vout (y-axis), a typical sinusoid the cycles around the value 1 V (DC output).
Transient evolutions, however are more interesting when the circuit has reactive components as capacitances or inductances, and some switches that open/close at certain time. With the theory of electrical linear circuits we can mathematically study the signals in the circuits and with Qucs we can verify our analysis.
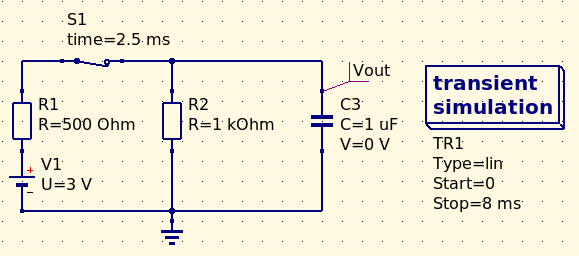
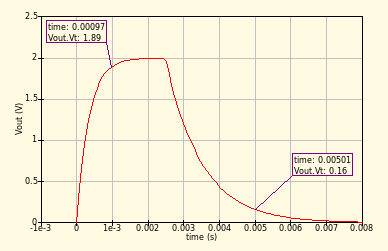
Suppose to analize the transient of the RC circuit in figure. The conditions at time t=0 are Vc3=0 and switch closed. From theory we know that τ, the time characteristics of the circuit are τ1=R1//R2*C3=0.3 ms and τ2=R2*C=1 ms, before and after the circuit switch. So the condensator will be charged after ~ 3*τ1=0.9 ms and completely discarged after ~ 3*τ2=3 ms. We open the switch at time t=2.5 ms.
Running the simulation we have this results, as expected.
You can Set Marker on the Graph, using the button M1 (alias Marker1).

