m (add GIT link →Test description) |
m (kvm64 results stability →Conclusion) |
||
| (5 intermediate revisions by the same user not shown) | |||
| Line 33: | Line 33: | ||
The results were measured using <code>scomes</code> (SystemTap script) which can be found in <code>tuned-utils</code> package. However we used the newest GIT version [http://git.fedorahosted.org/git/tuned.git?p=tuned.git;a=blob_plain;f=contrib/scomes;hb=e5c73033aeb67ad9848721301e02628dea25c808]. | The results were measured using <code>scomes</code> (SystemTap script) which can be found in <code>tuned-utils</code> package. However we used the newest GIT version [http://git.fedorahosted.org/git/tuned.git?p=tuned.git;a=blob_plain;f=contrib/scomes;hb=e5c73033aeb67ad9848721301e02628dea25c808]. | ||
The test run 10 times in sequence. Clean caches, dentries and inodes were dropped before each run | The test run 10 times in sequence. Clean caches, dentries and inodes were dropped before each run: | ||
echo 3 > /proc/sys/vm/drop_caches | |||
The measured task was building <code>squid</code> RPM package from src.rpm: | The measured task was building <code>squid</code> RPM package from src.rpm: | ||
| Line 160: | Line 162: | ||
| max || 189830 || 179318 || 187081 || 179870 || -5.54% || -3.85% | | max || 189830 || 179318 || 187081 || 179870 || -5.54% || -3.85% | ||
|} | |} | ||
[[File:Testcase_Virtualized_32bit_vs_64bit_Graph_Syscalls.png]] | |||
=== ticks count === | === ticks count === | ||
| Line 176: | Line 180: | ||
| max || 21269 || 15268 || 8151 || 8674 || -28.21% || 6.42% | | max || 21269 || 15268 || 8151 || 8674 || -28.21% || 6.42% | ||
|} | |} | ||
[[File:Testcase_Virtualized_32bit_vs_64bit_Graph_Kernel_Ticks.png]] | |||
==== userspace ==== | ==== userspace ==== | ||
| Line 190: | Line 196: | ||
| max || 6057 || 8232 || 6057 || 2130 || 35.91% || -64.83% | | max || 6057 || 8232 || 6057 || 2130 || 35.91% || -64.83% | ||
|} | |} | ||
[[File:Testcase_Virtualized_32bit_vs_64bit_Graph_Userspace_Ticks.png]] | |||
==== total ==== | ==== total ==== | ||
| Line 204: | Line 212: | ||
| max || 26190 || 23137 || 14011 || 10804 || -11.66% || -22.89% | | max || 26190 || 23137 || 14011 || 10804 || -11.66% || -22.89% | ||
|} | |} | ||
[[File:Testcase_Virtualized_32bit_vs_64bit_Graph_Total_Ticks.png]] | |||
=== read/written bytes === | === read/written bytes === | ||
| Line 220: | Line 230: | ||
| max || 32850019 || 21770053 || 30935608 || 20019461 || -33.73% || -35.29% | | max || 32850019 || 21770053 || 30935608 || 20019461 || -33.73% || -35.29% | ||
|} | |} | ||
[[File:Testcase_Virtualized_32bit_vs_64bit_Graph_Data_Read.png]] | |||
==== written ==== | ==== written ==== | ||
| Line 234: | Line 246: | ||
| max || 20263640 || 19564938 || 20265990 || 19549543 || -3.45% || -3.54% | | max || 20263640 || 19564938 || 20265990 || 19549543 || -3.45% || -3.54% | ||
|} | |} | ||
[[File:Testcase_Virtualized_32bit_vs_64bit_Graph_Data_Written.png]] | |||
==== total ==== | ==== total ==== | ||
| Line 249: | Line 263: | ||
|} | |} | ||
[[File:Testcase_Virtualized_32bit_vs_64bit_Graph_Data_Total.png]] | |||
== Conclusion == | |||
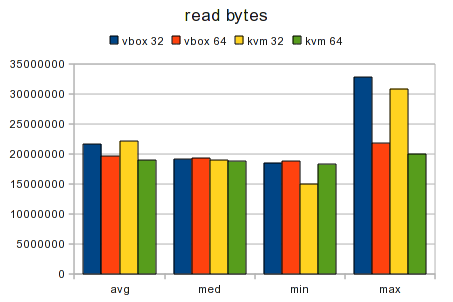
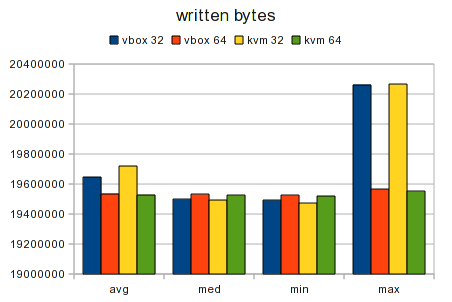
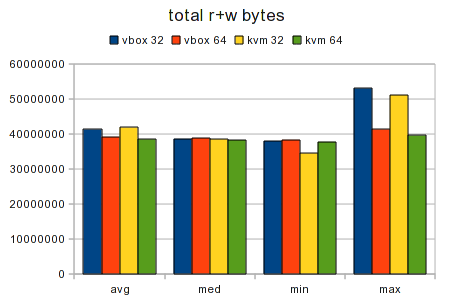
According to the graphs the most stable results are provided by KVM 64-bit. | |||
If we consider the average results to be predicative, it seems that there is almost no difference in syscall count between the architectures and virtualization tools. | If we consider the average results to be predicative, it seems that there is almost no difference in syscall count between the architectures and virtualization tools. | ||
Latest revision as of 12:20, 22 September 2009
The main aim of this test was comparison of syscall count, tick count, read/written bytes when performing the same task on virtual 32-bit and 64-bit machine.
System configuration
We used VirtualBox OSE and KVM to perform this test. All virtual machines run on the same physical machine (not simultaneously) in the same configuration.
- The host configuration:
- Intel Core 2 Duo E8400 3GHz
- 4 GB of memory
- Fedora 11 (2.6.30.5-43.fc11.x86_64)
- VirtualBox 3.0.4_OSE r50677
- libvirt 0.6.2-17.fc11, qemu 2:0.10.6-4.fc11
- The guest configuration in VirtualBox:
- 1 CPU (32bit or 64bit)
- 1024 MB of memory
- ACPI: enabled, PAE/NX: enabled, VT-x: enabled, Nested paging: enabled
- Fedora Rawhide (2009-09-16), i686 or x86_64
- VirtualBox Guest Additions
- The guest configuration in KVM
- 1 CPU (i686 or x86_64)
- 1024 MB or memory
- Fedora Rawhide (2009-09-16), i686 or x86_64
- virtio disk
Test description
The results were measured using scomes (SystemTap script) which can be found in tuned-utils package. However we used the newest GIT version [1].
The test run 10 times in sequence. Clean caches, dentries and inodes were dropped before each run:
echo 3 > /proc/sys/vm/drop_caches
The measured task was building squid RPM package from src.rpm:
./scomes.stp -c "rpmbuild --rebuild squid-3.1.0.13-3.fc12.src.rpm" 0
Uprocessed results
VirtualBox 32-bit guest
| syscalls | kernel ticks | userspace ticks | read bytes | written bytes | |
|---|---|---|---|---|---|
| 1 | 176379 | 9169 | 5860 | 19815353 | 19496541 |
| 2 | 175957 | 9410 | 6057 | 19434866 | 19502130 |
| 3 | 175336 | 9341 | 5553 | 18696381 | 19489876 |
| 4 | 175072 | 9063 | 5522 | 18815017 | 19495984 |
| 5 | 175316 | 9186 | 5542 | 18788471 | 19495878 |
| 6 | 176232 | 9033 | 5353 | 19460705 | 19501778 |
| 7 | 174503 | 8979 | 5621 | 18517294 | 19489876 |
| 8 | 188483 | 21269 | 4921 | 31460765 | 20263640 |
| 9 | 189830 | 9248 | 5811 | 32850019 | 20232887 |
| 10 | 175268 | 19736 | 4881 | 18657208 | 19492557 |
VirtualBox 64-bit guest
| syscalls | kernel ticks | userspace ticks | read bytes | written bytes | |
|---|---|---|---|---|---|
| 1 | 175694 | 14905 | 8232 | 21770053 | 19564938 |
| 2 | 177300 | 14098 | 8037 | 19354317 | 19529482 |
| 3 | 179318 | 15268 | 7757 | 20555112 | 19549143 |
| 4 | 177070 | 9890 | 4724 | 18915315 | 19523128 |
| 5 | 177867 | 9826 | 4824 | 19321045 | 19529497 |
| 6 | 177306 | 10282 | 4792 | 18802447 | 19523195 |
| 7 | 178227 | 10220 | 4823 | 19181444 | 19531070 |
| 8 | 178271 | 9927 | 4855 | 19824862 | 19540823 |
| 9 | 178032 | 10149 | 4833 | 19304156 | 19529428 |
| 10 | 177906 | 10395 | 4798 | 19360721 | 19529566 |
KVM 32-bit guest
| syscalls | kernel ticks | userspace ticks | read bytes | written bytes | |
|---|---|---|---|---|---|
| 1 | 174540 | 8151 | 2571 | 19280444 | 19486683 |
| 2 | 174399 | 7673 | 2181 | 18968357 | 19495090 |
| 3 | 186836 | 7546 | 2224 | 30935608 | 20265990 |
| 4 | 174674 | 7487 | 2218 | 19028456 | 19494972 |
| 5 | 174393 | 7456 | 2193 | 18782550 | 19490383 |
| 6 | 174520 | 7380 | 2213 | 18857743 | 19487497 |
| 7 | 186927 | 7637 | 2216 | 30870324 | 20263823 |
| 8 | 174531 | 7415 | 2235 | 18720100 | 19490277 |
| 9 | 171019 | 7261 | 2073 | 15000148 | 19468860 |
| 10 | 187081 | 7662 | 2256 | 30930304 | 20265406 |
KVM 64-bit guest
| syscalls | kernel ticks | userspace ticks | read bytes | written bytes | |
|---|---|---|---|---|---|
| 1 | 173268 | 8092 | 1959 | 19782678 | 19532133 |
| 2 | 179307 | 8181 | 1979 | 19696304 | 19535759 |
| 3 | 179870 | 8234 | 1980 | 20019461 | 19549543 |
| 4 | 178176 | 8674 | 2130 | 19169793 | 19529757 |
| 5 | 176884 | 7736 | 2087 | 18466457 | 19518977 |
| 6 | 177183 | 6532 | 1975 | 18316321 | 19521145 |
| 7 | 177831 | 6413 | 1985 | 18794279 | 19521145 |
| 8 | 177022 | 6346 | 1864 | 18241975 | 19519216 |
| 9 | 177116 | 6447 | 1920 | 18445540 | 19523166 |
| 10 | 177891 | 6342 | 1905 | 18695531 | 19523532 |
Results
syscalls count
| VBox 32bit | VBox 64bit | KVM 32bit | KVM 64bit | VBox 32→64 increase | KVM 32→64 increase | |
|---|---|---|---|---|---|---|
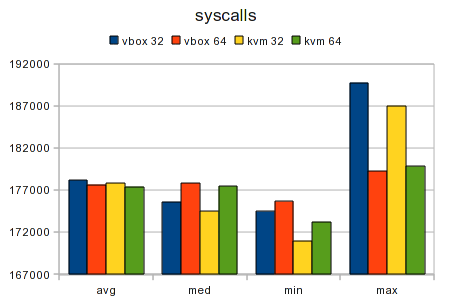
| average | 178237.6 | 177699.1 | 177892 | 177454.8 | -0.30% | -0.25% |
| median | 175646.5 | 177886.5 | 174535.5 | 177507 | 1.28% | 1.70% |
| min | 174503 | 175694 | 171019 | 173268 | 0.68% | 1.32% |
| max | 189830 | 179318 | 187081 | 179870 | -5.54% | -3.85% |
ticks count
kernel
| VBox 32bit | VBox 64bit | KVM 32bit | KVM 64bit | VBox 32→64 increase | KVM 32→64 increase | |
|---|---|---|---|---|---|---|
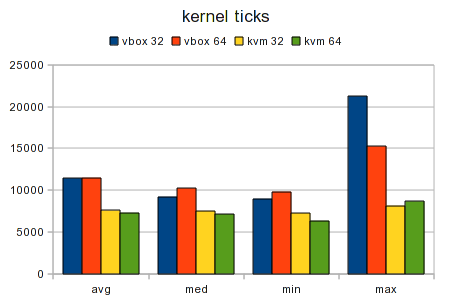
| average | 11443.4 | 11496 | 7566.8 | 7299.7 | 0.46% | -3.53% |
| median | 9217 | 10251 | 7516.5 | 7134 | 11.22% | -5.09% |
| min | 8979 | 9826 | 7261 | 6342 | 9.43% | -12.66% |
| max | 21269 | 15268 | 8151 | 8674 | -28.21% | 6.42% |
userspace
| VBox 32bit | VBox 64bit | KVM 32bit | KVM 64bit | VBox 32→64 increase | KVM 32→64 increase | |
|---|---|---|---|---|---|---|
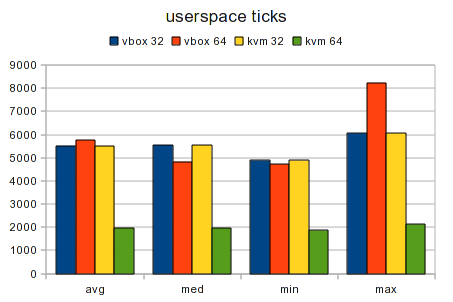
| average | 5512.1 | 5767.5 | 5512.1 | 1978.4 | 4.63% | -64.11% |
| median | 5547.5 | 4828.5 | 5547.5 | 1977 | -12.96% | -64.36% |
| min | 4881 | 4724 | 4881 | 1864 | -3.22% | -61.81% |
| max | 6057 | 8232 | 6057 | 2130 | 35.91% | -64.83% |
total
| VBox 32bit | VBox 64bit | KVM 32bit | KVM 64bit | VBox 32→64 increase | KVM 32→64 increase | |
|---|---|---|---|---|---|---|
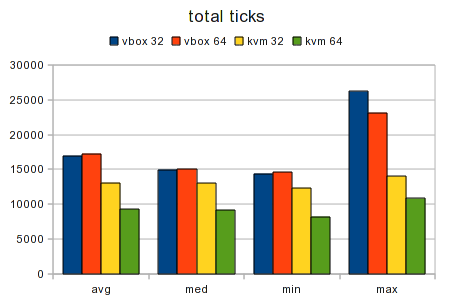
| average | 16955.5 | 17263.5 | 13078.9 | 9278.1 | 1.82% | -29.06% |
| median | 14961.5 | 15058.5 | 13040.5 | 9165 | 0.65% | -29.72% |
| min | 14386 | 14614 | 12336 | 8210 | 1.58% | -33.45% |
| max | 26190 | 23137 | 14011 | 10804 | -11.66% | -22.89% |
read/written bytes
read
| VBox 32bit | VBox 64bit | KVM 32bit | KVM 64bit | VBox 32→64 increase | KVM 32→64 increase | |
|---|---|---|---|---|---|---|
| average | 21649607.9 | 19638947.2 | 22137403.4 | 18962833.9 | -9.29% | -14.34% |
| median | 19124941.5 | 19337681 | 18998406.5 | 18744905 | 1.11% | -1.33% |
| min | 18517294 | 18802447 | 15000148 | 18241975 | 1.54% | 21,61% |
| max | 32850019 | 21770053 | 30935608 | 20019461 | -33.73% | -35.29% |
written
| VBox 32bit | VBox 64bit | KVM 32bit | KVM 64bit | VBox 32→64 increase | KVM 32→64 increase | |
|---|---|---|---|---|---|---|
| average | 19646114.7 | 19535027 | 19720898.1 | 19527437.3 | -0.57% | -0.98% |
| median | 19496262.5 | 19529531.5 | 19492677.5 | 19523349 | 0.17% | 0.16% |
| min | 19489876 | 19523128 | 19468860 | 19518977 | 0.17% | 0.26% |
| max | 20263640 | 19564938 | 20265990 | 19549543 | -3.45% | -3.54% |
total
| VBox 32bit | VBox 64bit | KVM 32bit | KVM 64bit | VBox 32→64 increase | KVM 32→64 increase | |
|---|---|---|---|---|---|---|
| average | 41295722.6 | 39173974.2 | 41858301.5 | 38490271.2 | -5.14% | -8.05% |
| median | 38623998.5 | 38867170.5 | 38493437.5 | 38267243.5 | 0.63% | -0.59% |
| min | 38007170 | 38325642 | 34469008 | 37761191 | 0.84% | 9.55% |
| max | 53082906 | 41334991 | 51201598 | 39569004 | -22.13% | -22.72% |
Conclusion
According to the graphs the most stable results are provided by KVM 64-bit.
If we consider the average results to be predicative, it seems that there is almost no difference in syscall count between the architectures and virtualization tools.
As for the ticks: The 64-bit system under VirtualBox produced totally a bit more ticks than 32-bit system (mostly in userspace). In KVM the difference is much bigger, 64-bit system needs a bit more kernel ticks but far fewer user ticks, which makes totally approximately 30% ticks less than 32-bit system.
The difference in read/written bytes on both virtualization tools is not wide (as we expected). There is only i difference between 32-bit and 64-bit system. It seems that the second one is a bit better in read byte count.

