From Fedora Project Wiki
(Created page with "{{QA/Test_Case |description=This test case tests whether the heap dump functionality in the Thermostat swing client works correctly. |setup= # Boot into the machine/VM you wis...") |
mNo edit summary |
||
| (2 intermediate revisions by the same user not shown) | |||
| Line 6: | Line 6: | ||
# Start the thermostat storage and agent: {{command|thermostat service &}} | # Start the thermostat storage and agent: {{command|thermostat service &}} | ||
# Start the thermostat Swing client: {{command|thermostat gui}} | # Start the thermostat Swing client: {{command|thermostat gui}} | ||
# Start another java application, like jedit or Freemeind | |||
|actions= | |actions= | ||
# | # Select the Java application that you started in the tree on the left and switch to the "Heap Analyzer" tab | ||
# Right click anywhere on the graph | |||
# Select "Heap Dump" | |||
# In a little while you should see a symbol like "V" on the chart. Double-click on it | |||
# Switch to the "Object Browser" tab | |||
# Try typing a class name (like "java.util.Map") in the search field | |||
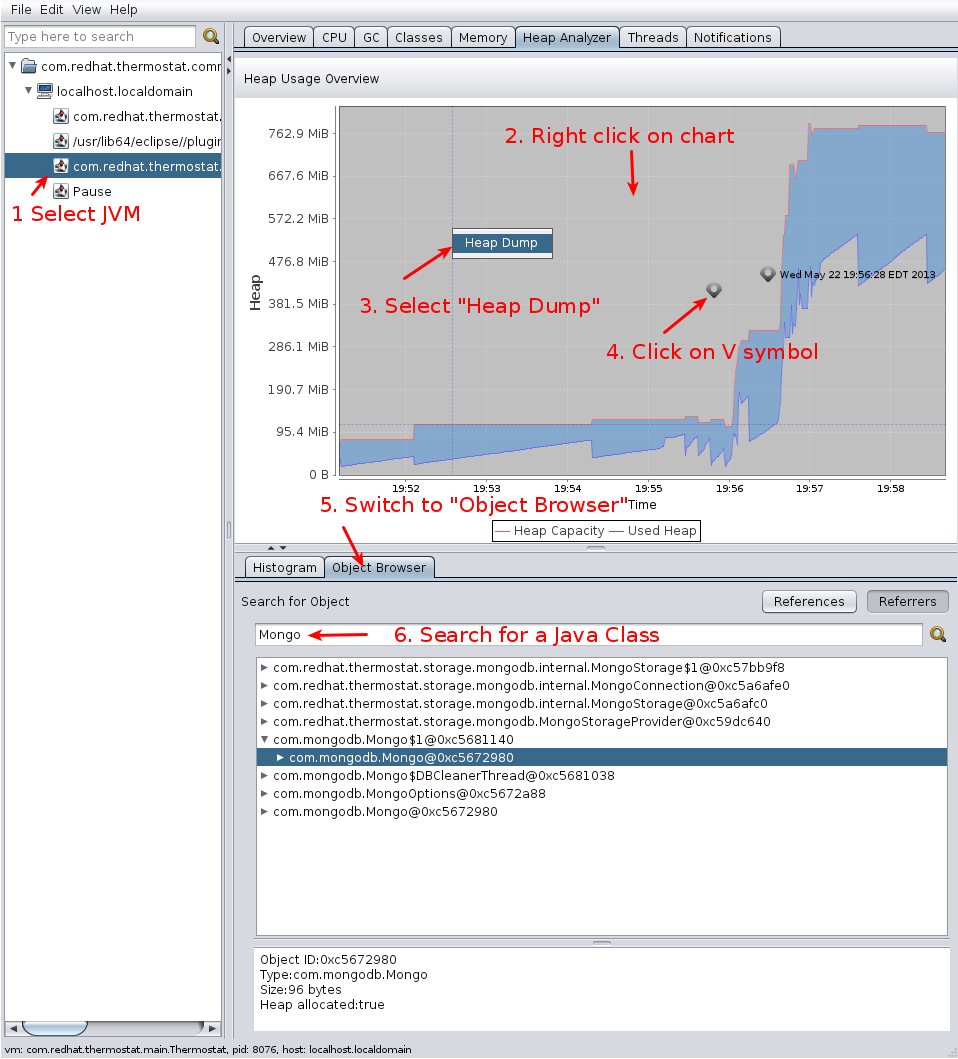
[[File:ThermostatSwingHeapDump.png]] | |||
|results= | |results= | ||
# | # Once you select "Heap Dump", you should see a "v"-like symbol | ||
# Selecting heap dump should cause the heap of the target application to be displayed | |||
# You should be able to switch between the "Histogram" and "Object Browser" tab | |||
# Searching for a class name should display all instances of the class in the Object browser and any referrers and references the instance holds | |||
# No exceptions or error messages should be printed anywhere | |||
}} | }} | ||
Latest revision as of 00:28, 23 May 2013
Description
This test case tests whether the heap dump functionality in the Thermostat swing client works correctly.
Setup
- Boot into the machine/VM you wish to test.
- If thermostat is not installed yet, install thermostat.
- Start the thermostat storage and agent:
thermostat service & - Start the thermostat Swing client:
thermostat gui - Start another java application, like jedit or Freemeind
How to test
- Select the Java application that you started in the tree on the left and switch to the "Heap Analyzer" tab
- Right click anywhere on the graph
- Select "Heap Dump"
- In a little while you should see a symbol like "V" on the chart. Double-click on it
- Switch to the "Object Browser" tab
- Try typing a class name (like "java.util.Map") in the search field
Expected Results
- Once you select "Heap Dump", you should see a "v"-like symbol
- Selecting heap dump should cause the heap of the target application to be displayed
- You should be able to switch between the "Histogram" and "Object Browser" tab
- Searching for a class name should display all instances of the class in the Object browser and any referrers and references the instance holds
- No exceptions or error messages should be printed anywhere


