Community Dashboard
The community dashboard is a research and analysis project. The goal is to help the team bring rigor to its goal-setting and also to give us a means of measuring success over time.
Community Biology 101
Community as a Catalyst
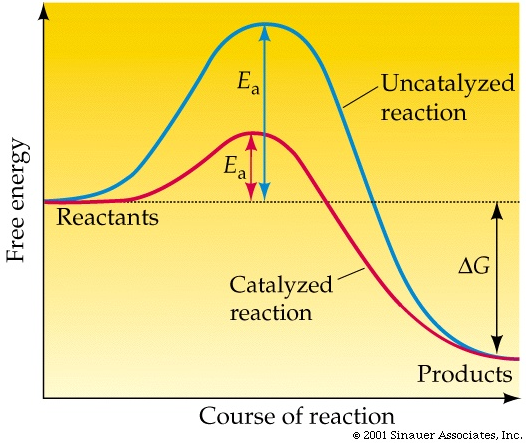
 http://www.columbia.edu/cu/biology/courses/c2005/purves6/figure06-14.jpg
Reaction: The progress of any task from idea to reality. This can be as simple as a one-page summary of Fedora 10 for the press, or as complicated as the feature planning process for Fedora 11. The task can be code, leadership, process documentation, testing, writing, artwork, etc.
For any reaction to complete requires some amount of energy. From a business point of view, energy, time, and money are all synonymous.
The blue curve represents a reaction that does not operate with a community-building mindset. Perhaps this is a proprietary software project, and community isn't even an option. Perhaps it is an open source upstream that is so focused on coding, it doesn't have the time to properly build a community. Either way, the amount of energy required to reach a successful end-state is high.
The red curve
