Feature Name
Eclipse Profiling Tools
Summary
We aim to bring the Linux Tools OProfile and Valgrind integration for the Eclipse IDE to Fedora.
Owner
- Name: Elliott Baron / Kent Sebastian
- Email: <ebaron at redhat> / <ksebasti at redhat>
Current status
- Targeted release: 11
- Last updated: 2009-02-19
- Percentage of completion: 100%
Detailed Description
The work being done upstream at eclipse.org is being driving by Fedora / Red Hat people. We are attempting to bring the power of various native profiling tools into the Eclipse IDE and integrate with the rest of the development environment. Our target audience is people developing with and for Linux distributions. The first group we are targetting is native application developers programming in C and C++.
Benefit to Fedora
This functionality will enhance our development environment, enabling developers who are familiar with integrated development environments to more easily move to Linux. Fedora remains at the forefront of Linux distributions containing Eclipse technology and this will enable us to continue to lead in this area.
Scope
Upstream development, testing, releases, packaging for Fedora. This feature is isolated and has nothing that depends upon it.
How To Test
We have unit tests and release tests upstream. We will package upstream releases directly and verify that test results match. Once we have releases and packages, we will put instructions here describing how package users can verify the test results against their installed packages. We will also post a simple set of steps one can follow to verify that the functionality is present and working.
Testing Valgrind Integration
Unit Testing
- Install eclipse-valgrind package and dependencies
- There is an obvious dependency on Valgrind which is only available on x86/x86_64 and ppc/ppc64
- Install eclipse-subclipse if it is not already installed
- Download this Project Set File
- In org.eclipse.linuxtools.valgrind.memcheck.tests and org.eclipse.linuxtools.massif.tests, right click on AllTests.java and select Run As -> JUnit Plug-in Test
- All tests should pass
Manual Testing
- Using a new or existing C/C++ project, right click it in the Project Explorer view and select Profile As -> Profile With Valgrind
- You can use these simple test projects. Import them via File->Import->General->Existing Projects into Workspace->Select archive file
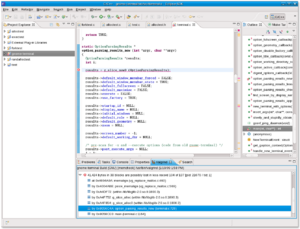
- The Valgrind View should appear after execution finishes, if there are any memory management errors, they will appear inside of it.
- For further testing, right click the project again in the Project Explorer view and select Profile As -> Profile Configurations
- Choose the Valgrind run configuration just created and select the "Valgrind Options" tab
- Select the "Tool to run" drop-down, memcheck and massif should be listed, select massif and click "Profile"
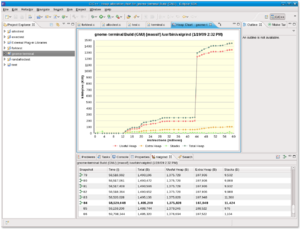
- The Valgrind View should appear after execution finishes, tabular heap allocation data should be shown in it. Also a line chart of this data should appear as the active editor.
Testing OProfile Integration
Unit Testing
- Install eclipse-oprofile package and dependencies
- There is an obvious dependency on OProfile
- Install eclipse-subclipse if it is not already installed
- Download this Project Set File
- In org.eclipse.linuxtools.oprofile.core.tests, right click on AllCoreTests.java and select Run As -> JUnit Plug-in Test
- All tests should pass
Manual Testing
- Using a new or existing C/C++ project, right click it in the Project Explorer view and select Profile As -> Profile With OProfile
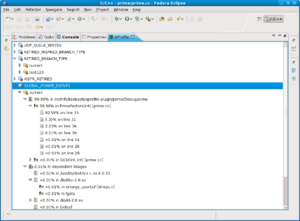
- The OProfile View should appear after execution finishes, with contents similar to this screenshot (with only 1 event, most likely GLOBAL_POWER_EVENTS or CPU_CLK_UNHALTED)
- For further testing, right click the project again in the Project Explorer view and select Profile As -> Profile Configurations
- Choose the OProfile run configuration for the project previously profiled, or create a new one by double-clicking on "Profile With OProfile" and filling in the required fields
- Click on the "Events" tab, and select a different configuration of events, click profile
- Verify that the selected events are displayed
- note that not all programs will elicit samples for all events, it is possible that no samples will be shown for the selected events
- Double-click on a 'sample' (bottom-most node) for a binary with available source; verify that it opens the file in an editor and sets the cursor at the appropriate line
User Experience
Valgrind
Screenshots of Valgrind plugins in action:


Video screencasts of the plugin in action: here and here
OProfile
Screenshot:

Video screencast of the plugin in action: here
Dependencies
We will need to review EMF, create packages for BIRT (and potentially some of its dependencies should we decide to package more than just the charting framework we need for Valgrind), and create packages for the 3 Linux Tools projects this feature encompasses: the profiling framework (not end-user visible but necessary for the other two), OProfile functionality, and Valgrind functionality. Due to timeline differences between Fedora 11 and Eclipse 3.5 (May and June respectively), we will most likely continue with Eclipse 3.4.x in Fedora 11 and thus won't depend upon other features.
Contingency Plan
Continue without such functionality in the distro.
Documentation
Release Notes
Nothing really needed
