| (10 intermediate revisions by one other user not shown) | |||
| Line 11: | Line 11: | ||
<center> | <center> | ||
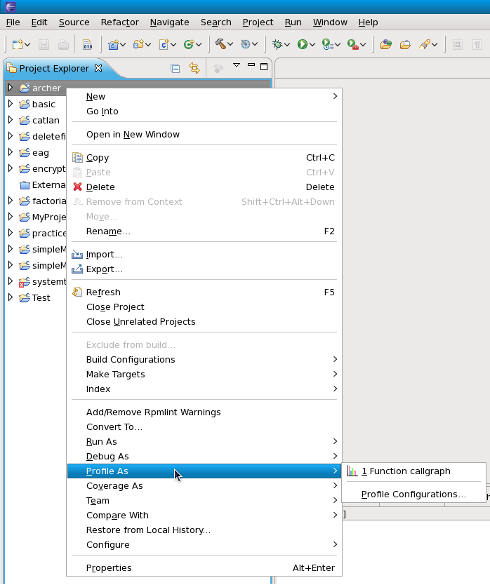
[[File:Profile-screen.png]] | [[File:Profile-screen.png]] | ||
</center> | </center> | ||
== Features == | == Features == | ||
'''Call Graph''' | '''Call Graph''' | ||
| Line 22: | Line 19: | ||
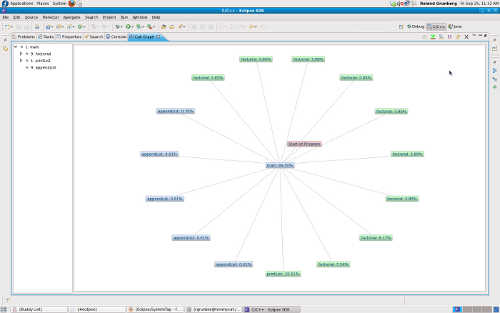
Renders a visual function trace of the program, tracking selected or all functions. | Renders a visual function trace of the program, tracking selected or all functions. | ||
This feature comes with a few different display options and various other information such as : | |||
* function parent/children relationships | |||
* number of times a function is called | |||
* time spent in an instance of a function | |||
* time spent in all instances of a function | |||
<center>[[File:Stapgraph menu.png]]</center> | <center>[[File:Stapgraph menu.png]]</center> | ||
| Line 37: | Line 38: | ||
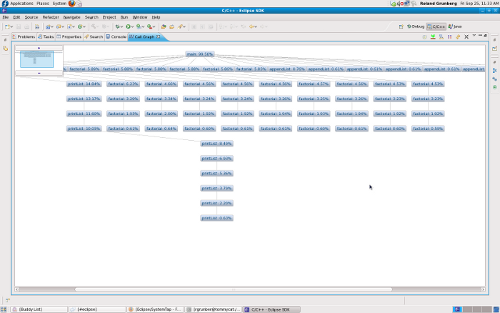
[[File:Aggregate_view.png]] | [[File:Aggregate_view.png]] | ||
The graph | |||
'''Linkage To Source Code''' | |||
The graph views are linked to their source code -- hold CTRL and double-click any function in a non-aggregate view to be taken to where that function was called. Doing the same for an aggregate node will take you to where that function is defined. | |||
''' Function Calls In Chronological Order''' | |||
Using the "Go To" menu, one can step through functions in chronological order, using the Previous/Next options. | |||
<center>[[FILE:Callgraph goto menu.png]]</center> | |||
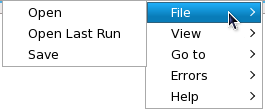
''' Open / Save Call Graphs ''' | |||
Certain large projects might take longer to render, and so users have the ability to save the data collected from having profiled their project. Loading the data file and attempting to render that will take a much shorter time than attempting to go through the full process of profiling a project. | |||
<center>[[FILE:Callgraph_file_menu.png]]</center> | |||
Latest revision as of 23:59, 1 October 2009
Installation
Installation of the Eclipse SystemTap plugin will be done through the yum repository. Users can simply type from command-line :
'yum install eclipse-callgraph'
General Usage
All the SystemTap plugins are accessible from the C/C++ perspective, by right clicking on C/C++ source file in the editor view, or by right clicking on the corresponding binary in the package explorer view.
Features
Call Graph
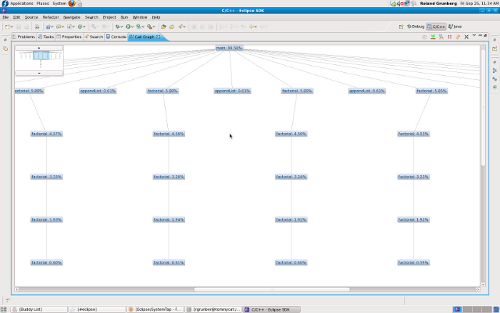
Renders a visual function trace of the program, tracking selected or all functions.
This feature comes with a few different display options and various other information such as :
- function parent/children relationships
- number of times a function is called
- time spent in an instance of a function
- time spent in all instances of a function
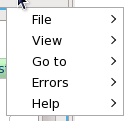
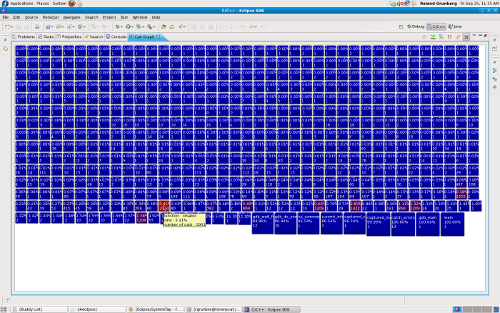
The following types of views are available to see the call hierarchy of the functions belonging to the executable.
Linkage To Source Code
The graph views are linked to their source code -- hold CTRL and double-click any function in a non-aggregate view to be taken to where that function was called. Doing the same for an aggregate node will take you to where that function is defined.
Function Calls In Chronological Order
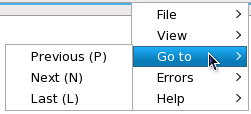
Using the "Go To" menu, one can step through functions in chronological order, using the Previous/Next options.
Open / Save Call Graphs
Certain large projects might take longer to render, and so users have the ability to save the data collected from having profiled their project. Loading the data file and attempting to render that will take a much shorter time than attempting to go through the full process of profiling a project.
