No edit summary |
No edit summary |
||
| Line 1: | Line 1: | ||
== Installation == | |||
Installation of the Eclipse SystemTap plugin will be done through the yum repository. Users can simply type from command-line : | Installation of the Eclipse SystemTap plugin will be done through the yum repository. Users can simply type from command-line : | ||
| Line 6: | Line 6: | ||
== General Usage == | |||
All the SystemTap plugins are accessible from the C/C++ perspective, by right clicking on C/C++ source file in the editor view, or by right clicking on the corresponding binary in the package explorer view. | All the SystemTap plugins are accessible from the C/C++ perspective, by right clicking on C/C++ source file in the editor view, or by right clicking on the corresponding binary in the package explorer view. | ||
| Line 14: | Line 14: | ||
== Features == | |||
1) Call Graph | 1) Call Graph | ||
Revision as of 19:48, 31 July 2009
Installation
Installation of the Eclipse SystemTap plugin will be done through the yum repository. Users can simply type from command-line :
'yum install systemtap-eclipse'
General Usage
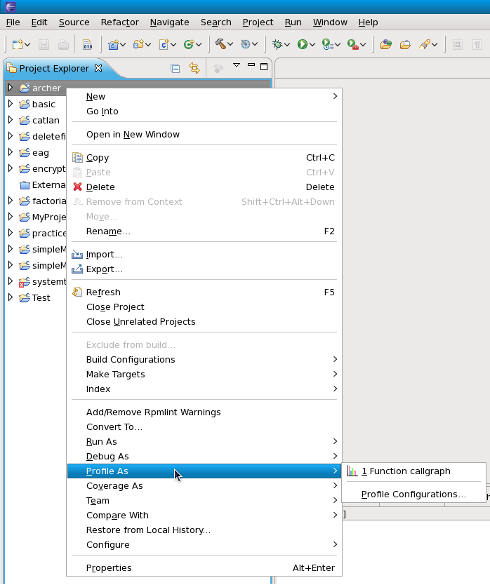
All the SystemTap plugins are accessible from the C/C++ perspective, by right clicking on C/C++ source file in the editor view, or by right clicking on the corresponding binary in the package explorer view.
Features
1) Call Graph
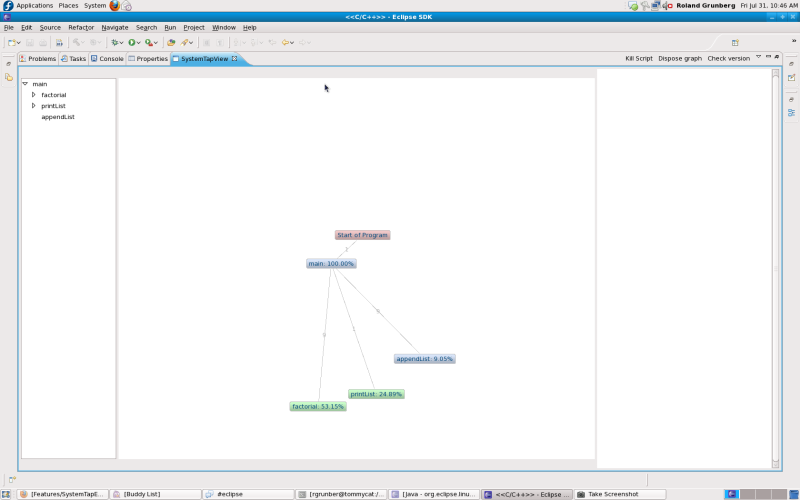
Clicking on the 'function callgraph' will render a visual representation of the functions that were called while running the executable.
2) File IO Monitor
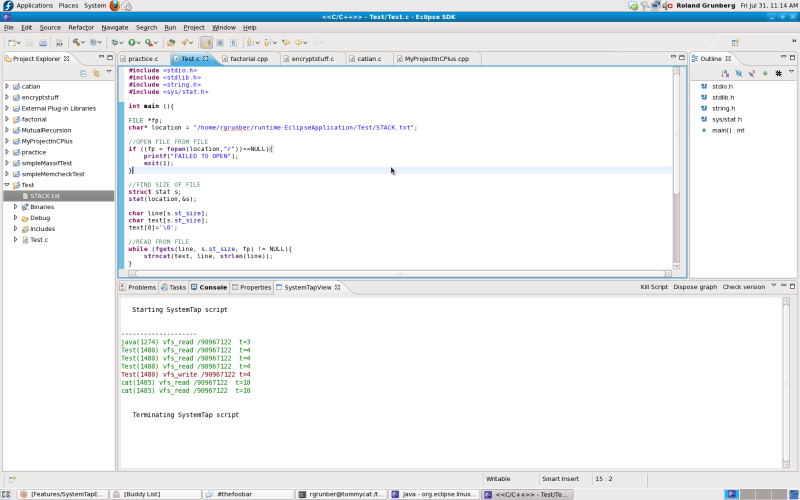
Click on 'File IO Monitor' will prompt the user to specify the location of a file. After this, any read/write calls to that file will be shown with the process that made the read/write call, and the time at which this happened.
This script must be stopped by the user by clicking the 'kill script' button, located within the SystemTap view.
- TODO : finish this


