| Line 27: | Line 27: | ||
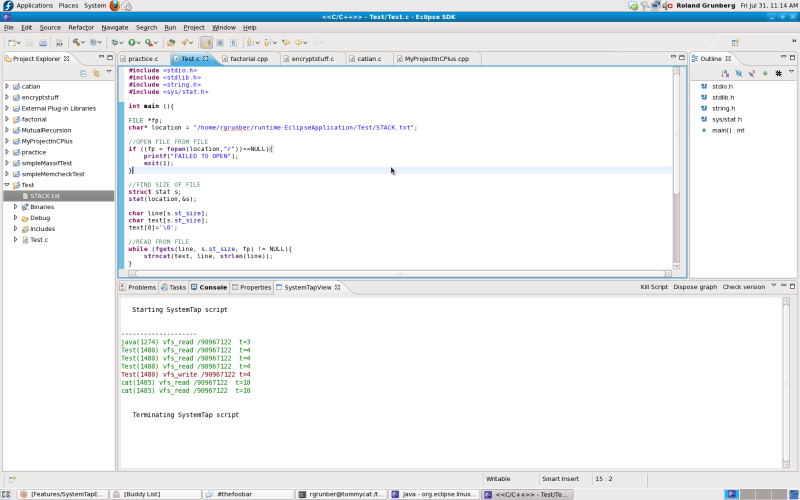
Click on 'File IO Monitor' will prompt the user to specify the location of a file. After this, any read/write calls to that file will be shown with the process that made the read/write call, and the time at which this happened. | Click on 'File IO Monitor' will prompt the user to specify the location of a file. After this, any read/write calls to that file will be shown with the process that made the read/write call, and the time at which this happened. | ||
Since this script can run for as long as is necessary, the user must manually stop the script by clicking on the 'kill script' button in the SystemTap view. | |||
[[File:Fileiomonitor scaled.png]] | [[File:Fileiomonitor scaled.png]] | ||
#TODO : finish this | #TODO : finish this | ||
Revision as of 19:55, 31 July 2009
Installation
Installation of the Eclipse SystemTap plugin will be done through the yum repository. Users can simply type from command-line :
'yum install systemtap-eclipse'
General Usage
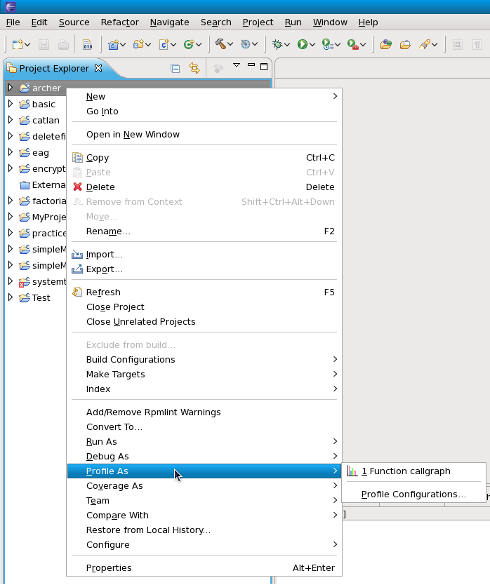
All the SystemTap plugins are accessible from the C/C++ perspective, by right clicking on C/C++ source file in the editor view, or by right clicking on the corresponding binary in the package explorer view.
Features
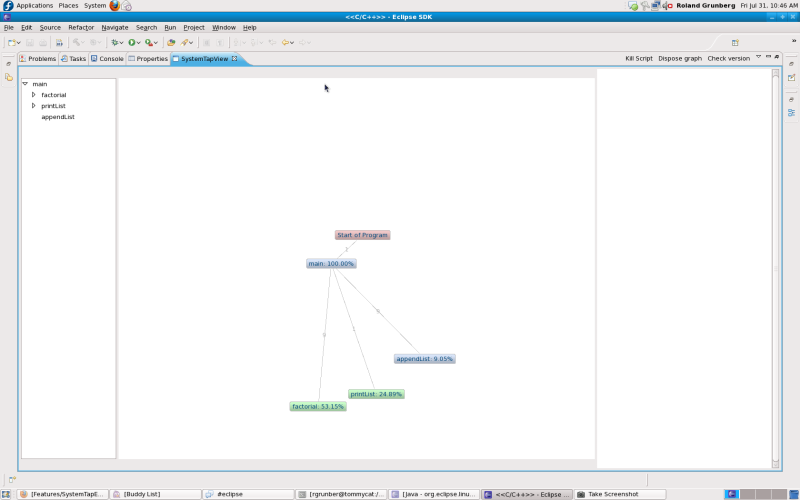
Call Graph
Clicking on the 'function callgraph' will render a visual representation of the functions that were called while running the executable.
File IO Monitor
Click on 'File IO Monitor' will prompt the user to specify the location of a file. After this, any read/write calls to that file will be shown with the process that made the read/write call, and the time at which this happened.
Since this script can run for as long as is necessary, the user must manually stop the script by clicking on the 'kill script' button in the SystemTap view.
- TODO : finish this


