Installation
Installation of the Eclipse SystemTap plugin will be done through the yum repository. Users can simply type from command-line :
'yum install systemtap-eclipse'
General Usage
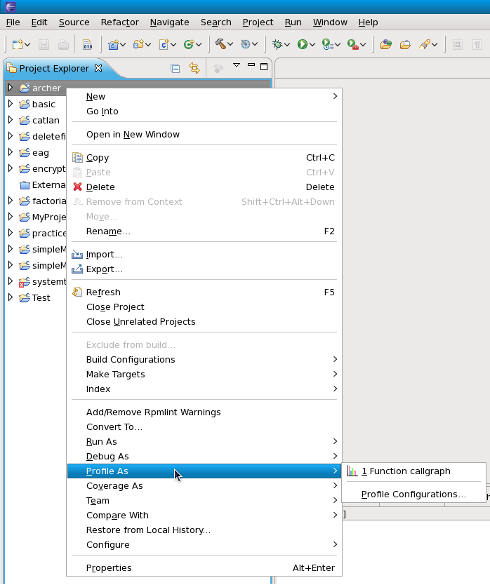
All the SystemTap plugins are accessible from the C/C++ perspective, by right clicking on C/C++ source file in the editor view, or by right clicking on the corresponding binary in the package explorer view.
Features
A few customized scripts will be made available, some built-in and others ready for download.
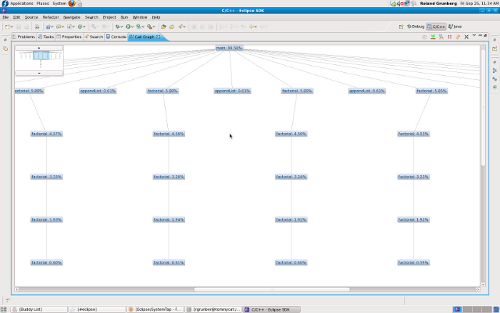
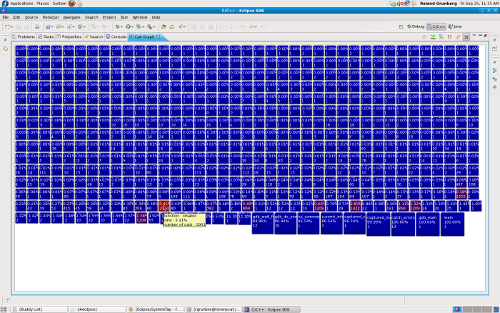
Call Graph
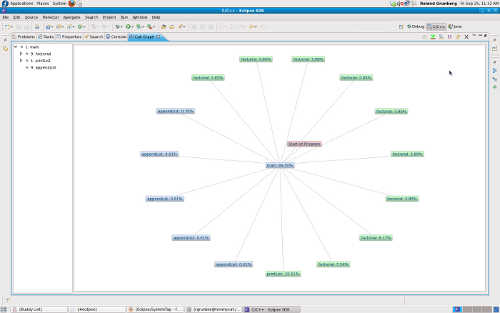
Renders a visual function trace of the program, tracking selected or all functions.
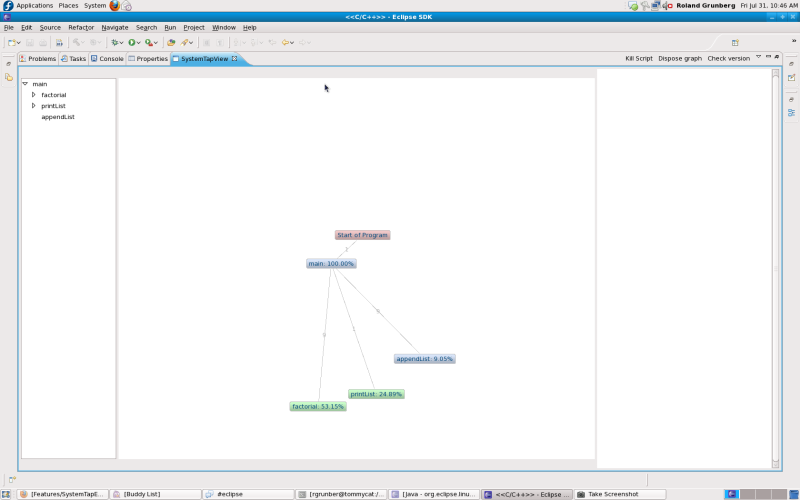
This feature comes with a few different display options and various other information such as the percentage time spent in a function and the number of times a function is called. All of these settings can be changed and accessed through the SystemTap view menu.
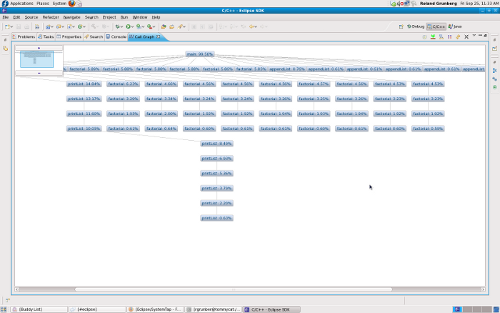
Also, the following types of views are available to see the call hierarchy of the functions belonging to the executable.
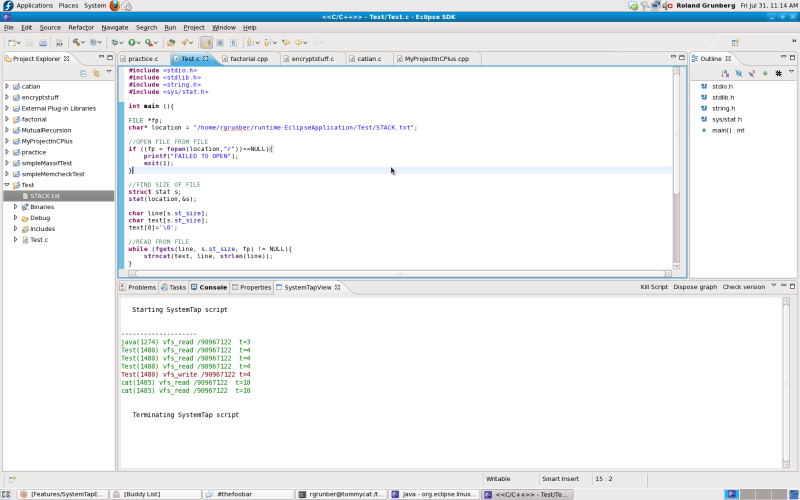
File IO Monitor
Monitors any read/write calls to a specific file in real-time. Displays the process that made the read/write call, and the time at which this happened.
Since this script can run for as long as is necessary, the user must manually stop the script by clicking on the 'kill script' button in the SystemTap view.
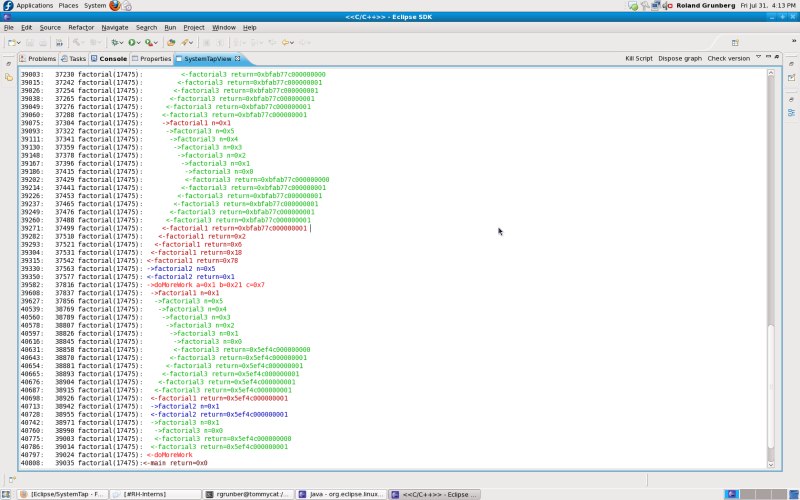
Function Trace
Renders a colourful text-based representation of the series of function calls, and returns that were executed.
Launch Wizard
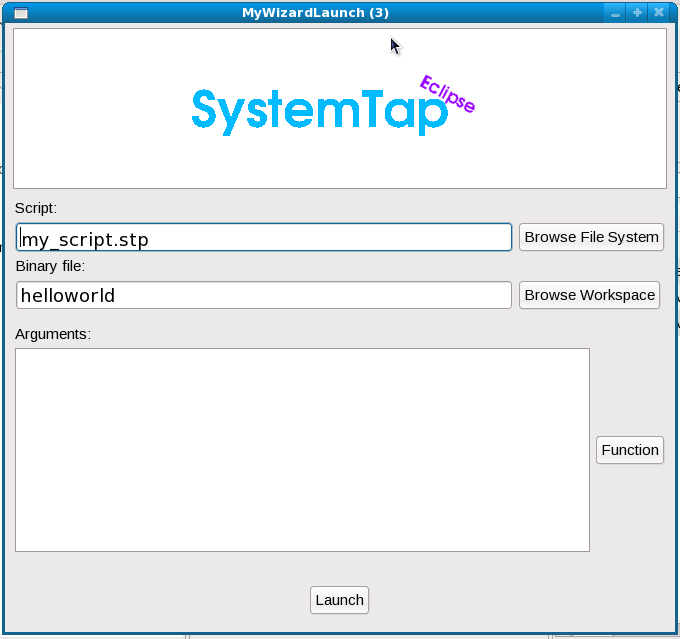
The 'Launch Wizard' opens a dialog that will allow the user to quickly launch any SystemTap script they've downloaded.
