How to use SPLAT!
SPLAT! is a Surface Path Length And Terrain analysis application which can perform path loss calculations as well as generate coverage maps.
Installation
Installing SPLAT! is straightforward:
su -c 'yum install splat'
Obtaining terrain files
Before it can be useful, SPLAT requires files that describe the terrain around the station to be modelled. First, determine the latitude and longitude of the station. Then download the nine terrain files centered on that latitude and longitude from http://e0srp01u.ecs.nasa.gov/srtm/version2/SRTM3/
Unzip the nine files and convert them from hgt files to sdf with the srtm2sdf utility. For example:
srtm2sdf N41W082.hgt
Do this for each of the nine files. Those files can now be placed in a directory where you wish to store terrain files, or they can be placed in the directory where you wish to work with SPLAT!
If you will be modelling stations over a wide geographic area, you may wish to download and convert additional files. SPLAT! will select those files it requires for a particular calculation.
Obtaining cartographic boundary files
SPLAT! will work with just the terrain files. However, for path loss maps, the resulting maps can be more useful if they are marked with political boundaries and names of towns and cities. For the United States, county outlines can be downloaded from http://www.census.gov/geo/www/cob/co2000.html#ascii and 'census designated areas' from http://www.census.gov/geo/www/cob/pl2000.html#ascii.
For each of these, there are two files, an xxyy_d00.dat and xxyy_d00a.dat, where xx is 'co' for county and 'pl' for place, and yy is a state number. A file of place names can be generated from the 'a' file with the citydecoder utility. For example:
citydecoder pl37 >cities.dat
The cities.dat file is simply a list of names followed by latitude and longitude. You may edit the file with a text editor to insert additional places which will be marked on the map with a red dot.
Using SPLAT!
SPLAT! can perform calculations for a particular path, or generate a map showing path loss or signal strength over a region. In any case SPLAT! needs at least one file identifying the transmitter location. For a specific path, it needs an identical file for the receiver. If you would like signal strength calculations, you will need another file with more details about the transmitter.
The QTH file
You tell SPLAT! about a particular station (transmitter or receiver) with a .qth file. This file has four lines:
- The name of the station
- The latitude of the station
- The longitude of the station
- The antenna height above ground
Here is an example .qth file:
W8KEA-4
43 38 05
84 15 41
124.0
The .qth file should be named for the station. The name of the file in the above example would be W8KEA-4.qth.
By default, SPLAT! uses British units; heights are in feet, distances are in miles. However, there is a switch to specify metric units.
The LRP file
If you would like SPLAT! to calculate signal strengths, it needs to know a little more about the transmitter. You provide this information in a file whose name matches that of the .qth file but has an extension of .lrp.
The .lrp file has 9 lines:
- Earth Dielectric Constant. If you do not have measured data available, the SPLAT! man page has a table that can help you estimate a value.
- Earth Conductivity
- Atmospheric Bending Constant
- Frequency
- Radio Climate. This is a code describing the terrain. See the table in the man page.
- Polarization
- Fraction of situations. This and the following line reflect how the Longley-Rice calculations are to be carried out. In the example below, SPLAT! will calculate the maximum path loss experienced 50% of the time in 50% of the situations.
- Fraction of time
- Effective radiated power - power out less feedline loss times antenna gain
15.000  ; Earth Dielectric Constant (Relative permittivity)
0.005   ; Earth Conductivity (Siemens per meter)
301.000 ; Atmospheric Bending Constant (N-Units)
145.090 ; Frequency in MHz (20 MHz to 20 GHz)
5       ; Radio Climate
1       ; Polarization (0 = Horizontal, 1 = Vertical)
0.50    ; Fraction of situations
0.50    ; Fraction of time
126.00  ; ERP
You may leave out the last line in which case SPLAT! will calculate only path loss.
Making a map of coverage
Once you have the above files you may invoke SPLAT! to generate a map of transmitter coverage by invoking it with a command like:
splat -t (transmitting station)  -L (hgt of rcv ant)  -R (max dist to calc) \
      -s (name of city file) \
      -d (directory for sdf files) \
      -b (county and place outline files) \
      -o Output.ppm
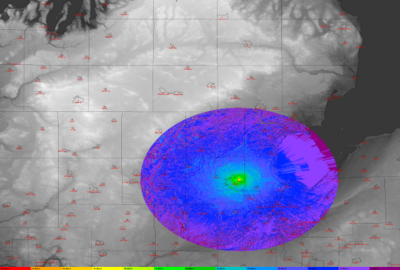
The SPLAT! output map is always in .ppm format. The -R parameter may be omitted, in which case SPLAT! will use a default. Selecting a larger calculation area will slow the calculation. The default area may not show the weaker areas but instead be cut off at some fixed distance as in the following image:
The legend along the bottom of the image shows the signal strength in log microvolts per meter if the ERP was provided, or the loss in decibels if it was not.
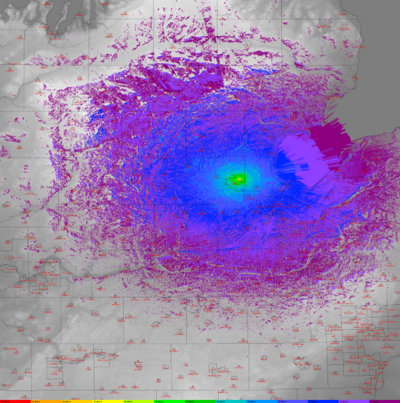
If the -R parameter is specified sufficiently large, the image will show more weakly covered areas, however, the calculation may take considerably longer:
Notice that SPLAT! adjusts the size of the image to include the covered area.
SPLAT! will create a file called (station).scf containing the values used for each of the colors. This file has a line for each signal strength, containing the strength followed by the red, green and blue components of the color.
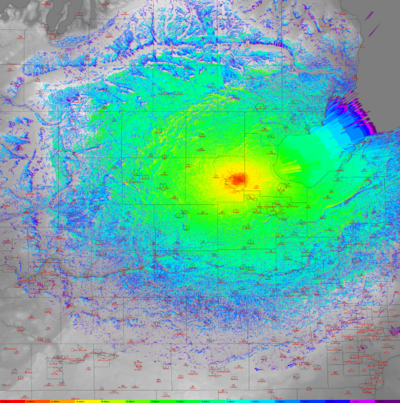
In the above maps, the transmitter is relatively low powered, resulting in a map where the stronger areas are very small. By adjusting the contours, the map may be made more useful, and custom colors may be selected as in the image below:
Calculating a point-to-point-path
SPLAT! can also provide insight into specific paths. For this, all nine terrain files are not required, only those in the path. A .qth file is required for both the transmitter and receiver. The following command will generate a report and graphs:
splat -t (transmitter)-4 -r (receiver) \
      -d (directory for sdf files) \
      -f (Frequency MHz for fresnel calculations) \
      -H (Normalized height graph) \
      -l (Path loss graph)
SPLAT! uses gnuplot to plot the graphs so they may be .png, .ps, .gif or any of the formats supported by gnuplot.
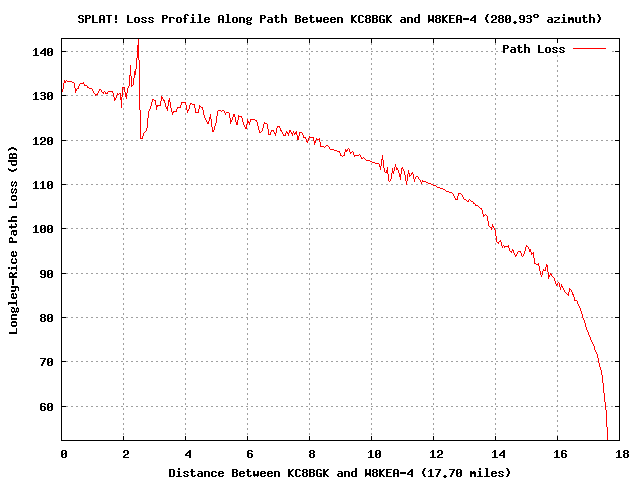
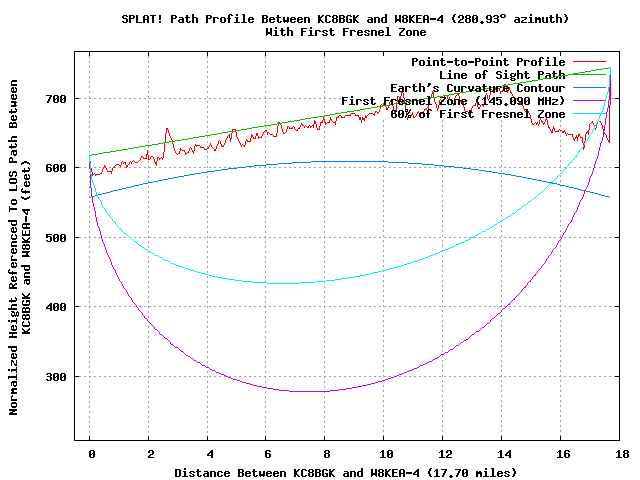
The frequency may be omitted in which case fresnel calculations are not performed. The graphs may also be omitted, and there are also additional graphs which can be selected. SPLAT! always produces a rather detailed text report. The path loss graph will look like:
while the normalized height graph will look like:


